




 Premium3
 Power Projections3
 AI Five5
PremiumMLB7:10 PM ET

 DodgersProjectedYoshinobu YamamotoStarting pitcher
 PadresMichael KingStarting pitcher
Projection
- Model
- 61%
- Market
- 55%
- Odds
- -122
Why Example: the published reasoning appears here on every card.
Free Dashboard AccessToday's research desk and the public graded record. No credit card.
EdgeSlate combines sport-specific models, calibrated probabilities, market context, and a public projection record in one quantitative research platform.
Research MLB, NBA, NFL, NHL, soccer, tennis, WNBA and college sports through transparent projections, model-versus-market probability, grading and daily reports.
Premium, Power, and AI Five on one daily research dashboard.


Today's board
A clearer view of today's board.
Today's highest-conviction Premium projections.
DodgersProjectedYoshinobu YamamotoStarting pitcherPadresMichael KingStarting pitcherWhy Example: the published reasoning appears here on every card.
 OilersProjected
 Canucks
Why Example: the published reasoning appears here on every card.
 BillsProjected
 Chiefs
Why Example: the published reasoning appears here on every card.
Promoted Power projections with model-versus-market context.
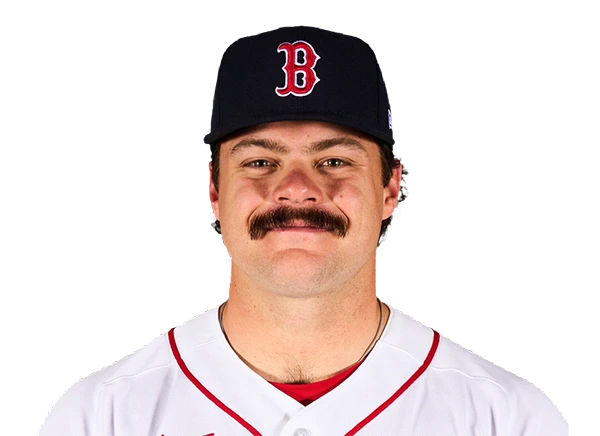
 Red SoxPayton TolleStarting pitcher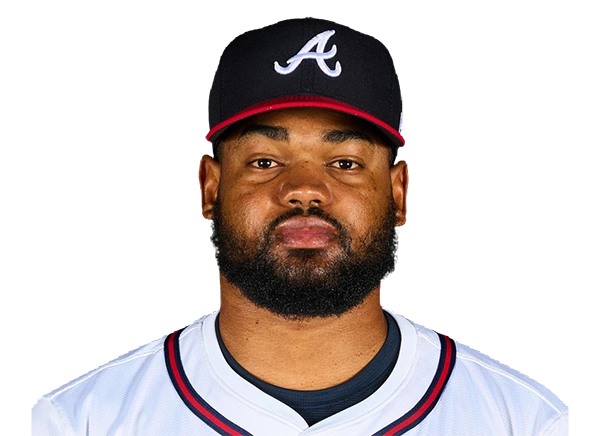
 BravesProjectedReynaldo LopezStarting pitcher
Why Example: the published reasoning appears here on every card.
 Nuggets
 ThunderProjected
Why Example: the published reasoning appears here on every card.
 Maple Leafs
 LightningProjected
Why Example: the published reasoning appears here on every card.
Independent AI Five seats in published order.
 Yankeesat
 Mets
MetsWhy Example: the published reasoning appears here on every card.
 Eaglesat
 Cowboys
Why Example: the published reasoning appears here on every card.
Don't take our word for it — inspect the public record. EdgeSlate is analytics software with graded History, not a sportsbook.
Every published result lives in History. Inspect the record.
Premium, Power, AI Five, and Value Dog when they qualify.
Current research board is temporarily unavailable. Showing the most recent accepted board from Sep 29, 2026.
EdgeSlate is a sports analytics and projection platform — not a sportsbook and not a tout sheet. Methodology holds the depth; this is the flow.
Sport-specific models read the day's games, market prices, and matchup context.
Premium, Power, AI Five, and Value Dog appear only when the published qualification rules are met. Empty days stay empty.
Accepted projections keep their capture and grade in the public History — inspect every result, not a highlight reel.
EdgeSlate organizes the daily research board into focused products without losing the underlying projection history and market context.
Example cards in the real dashboard design. Illustrative values.
Board-wide featured projections selected from the strongest lawful opportunities available.
DodgersProjectedYoshinobu YamamotoStarting pitcherPadresMichael KingStarting pitcherWhy Example: the published reasoning appears here on every card.
Selective 1–5 modeled projections published per active sport when lawful evidence supports it.
Red SoxPayton TolleStarting pitcherBravesProjectedReynaldo LopezStarting pitcherWhy Example: the published reasoning appears here on every card.
Five morning AI-ranked selections when the lawful daily universe contains at least five eligible candidates; fewer only when the available lawful universe itself is smaller.
YankeesatMetsWhy Example: the published reasoning appears here on every card.
Plus-money underdogs
The best qualified positive-odds selection when qualifying conditions are met.
Only when qualified
Premium Props and Power Props appear on the board only when seats qualify. They are not a guaranteed daily product.
Overlay, not a product
Cross-signal overlay on entitled projections. Not a separate product lane.
Recap & grading
Prior-day recap, current board context, calibration notes, and public grading.
Free dashboard access
Create your account for Free Dashboard Access. No credit card and not all-access; this is not the paid 7-Day All-Access pass. Your access details appear right after signup. 21+.
Today's board
A clearer view of today's board.
Today's highest-conviction Premium projections.
DodgersProjectedYoshinobu YamamotoStarting pitcherPadresMichael KingStarting pitcherWhy Example: the published reasoning appears here on every card.
OilersProjectedCanucksWhy Example: the published reasoning appears here on every card.
BillsProjectedChiefsWhy Example: the published reasoning appears here on every card.
Promoted Power projections with model-versus-market context.
Red SoxPayton TolleStarting pitcherBravesProjectedReynaldo LopezStarting pitcherWhy Example: the published reasoning appears here on every card.
NuggetsThunderProjectedWhy Example: the published reasoning appears here on every card.
Maple LeafsLightningProjectedWhy Example: the published reasoning appears here on every card.
Independent AI Five seats in published order.
YankeesatMetsWhy Example: the published reasoning appears here on every card.
EaglesatCowboysWhy Example: the published reasoning appears here on every card.
EdgeSlate brings sport-specific analysis, calibrated probabilities, market context, independent evidence and a public published record into one research workspace.
Current lines, market probabilities, matchup context, availability and sport-specific inputs establish the research environment.
Sport-specific and market-specific quantitative models evaluate eligible games rather than applying a blanket formula across all sports.
Calibration, evidence quality, conflicting signals, and reliability checks determine which projections earn featured placement on the active board.
Published projections preserve their market capture and record state so outcomes can be audited in public History and Daily Reports.
Multiple independent areas of EdgeSlate analysis strongly support this projection with limited conflicting evidence.
High Alignment is not another projection or a separate product. It is an evidence overlay that appears only when an existing EdgeSlate projection satisfies the independent-evidence requirements.
BOS Celtics vs NY Knicks · Moneyline
+7.4% Calibrated Edge
Each projection preserves verified historical context from the immutable record. When weather or injury reports were not part of the published telemetry, the interface never synthesizes them.
Mathematical model reasoning and verifiable statistical edge breakdown.
Model probability vs. market implied probability, executed price, and closing line value (CLV).
Graded outcome with official final score and immutable public-record manifest provenance.

Market Edge: Market-implied 57.1%, model 58.7%, edge +1.5%.
Baseball research weighs starter quality and bullpen strain; NFL research weighs EPA, injuries and weather; hockey research weighs starting goalies and expected goals. Each desk has its own analytical focus.
MLB projections and analytics for moneylines, run lines, F5 and totals, using starter quality, bullpen strain, park factors and weather.
NBA projections and analytics for spreads, moneylines and totals, plus player-prop research using pace, injuries, rest and efficiency.
NFL projections and analytics for moneylines, point spreads, game and team totals, plus player-prop research using EPA/play, quarterback efficiency, pressure rates, injuries and venue weather.
NHL projections and analytics for puck lines, moneylines and totals, using starting-goalie quality, expected goals and special teams.
Soccer projections and analytics for 1X2, Draw No Bet, totals and BTTS across major professional leagues, using xG/xGA, form and rotation.
Tennis projections and analytics for match moneylines, game handicaps and set totals using surface, serve/return and rest.
WNBA projections and analytics for spreads, moneylines and totals, plus player-prop research using pace, rotation and minutes.
NCAAF projections and analytics for spreads, moneylines and totals using quarterback/offense context, matchup strength and travel/home field.
NCAAB projections and analytics for spreads, moneylines and totals using tempo, offensive/defensive efficiency and home-court context.
NCAAW projections and analytics for spreads, moneylines and totals using tempo, rotation continuity and efficiency.
Different sports require different markets and different inputs. Explore the projection coverage available across each EdgeSlate research desk.
NFL projections and analytics for moneylines, point spreads, game and team totals, plus player-prop research using EPA/play, quarterback efficiency, pressure rates, injuries and venue weather.
NFL matchup analysis weighs EPA/play, drive efficiency, pressure rates and situational football to assess spreads and moneylines.
Evaluates scoring drives, red-zone efficiency, field position and matchup tendencies to assess game and team-total outcomes.
Uses target share, air yards, snap counts and run-blocking against opposing box counts. Player Props Research — research-only while production validation is in progress.
Weighs goal-to-go carry share and red-zone target distribution when assessing anytime-touchdown research.
MLB projections and analytics for moneylines, run lines, F5 and totals, using starter quality, bullpen strain, park factors and weather.
MLB research weighs park-adjusted team wOBA, pitcher run suppression and matchup context to assess moneyline and run-line outcomes.
Isolates the starting-pitcher matchup so late-inning bullpen variance does not dominate first-five research.
Accounts for park carry, wind, temperature and fly-ball tendencies when assessing game and team totals.
Uses swinging-strike rates and opposing lineup contact profiles. Player Props Research — research-only while production validation is in progress.
NBA projections and analytics for spreads, moneylines and totals, plus player-prop research using pace, injuries, rest and efficiency.
Analyzes pace, lineup efficiency, matchup strength and home-court context to assess spread and moneyline outcomes.
Combines expected possessions with half-court and transition shooting efficiency to assess game totals.
Uses usage, rebound chances and positional defensive matchups. Player Props Research — research-only while production validation is in progress.
Accounts for corner versus above-the-break attempt mix against opposing perimeter contest rates.
NHL projections and analytics for puck lines, moneylines and totals, using starting-goalie quality, expected goals and special teams.
Separates 5-on-5 expected-goal strength from overtime volatility when assessing moneylines.
Accounts for late empty-net and trailing-game states when assessing puck-line outcomes.
Combines high-danger chance volume with starting-goalie quality to assess totals.
Uses ice time, power-play role and unblocked shot rates for shots-on-goal research.
WNBA projections and analytics for spreads, moneylines and totals, plus player-prop research using pace, rotation and minutes.
WNBA research uses pace-adjusted efficiency for 40-minute play to assess spreads and moneylines.
Accounts for transition speed and perimeter shooting volume when assessing totals.
Uses usage, rebound rates and assist conversion. Player Props Research — research-only while production validation is in progress.
Soccer projections and analytics for 1X2, Draw No Bet, totals and BTTS across major professional leagues, using xG/xGA, form and rotation.
Soccer research uses expected-goal quality to assess three-way match probabilities across major professional leagues.
Draw-safe coverage for low-scoring stalemates in the professional leagues EdgeSlate currently publishes.
Combines chance quality and defensive suppression to assess BTTS and totals.
Uses continuous scoreline context to assess quarter-ball and half-ball handicap value.
Tennis projections and analytics for match moneylines, game handicaps and set totals using surface, serve/return and rest.
Tennis research uses hold and break rates by surface to assess match-winner probabilities.
Accounts for best-of-three versus Grand Slam best-of-five formats when assessing game and set handicaps.
Combines serve efficiency and tiebreak likelihood to assess total games.
NCAAF projections and analytics for spreads, moneylines and totals using quarterback/offense context, matchup strength and travel/home field.
NCAAF research weighs roster talent, conference strength and EPA context to assess spreads and moneylines.
Accounts for tempo, drive efficiency and mismatch games when assessing totals.
NCAAB projections and analytics for spreads, moneylines and totals using tempo, offensive/defensive efficiency and home-court context.
NCAAB research uses adjusted efficiency across Division I strength tiers to assess spreads and moneylines.
Accounts for half-court versus transition tempo when assessing totals.
NCAAW projections and analytics for spreads, moneylines and totals using tempo, rotation continuity and efficiency.
NCAAW research uses efficiency calibrated to women's college possession flow to assess spreads and moneylines.
Accounts for transition speed and perimeter shooting when assessing totals.
Public records, separated products, and transparent result states.
Transparency first: the historical record is public, tracked by product, and non-counted review states stay out of win/loss math.
Shows the latest graded high-confidence performance. When yesterday's projections are graded, this preview updates from the live history endpoint instead of static examples.
Recent verified results (Latest verified recap · Sep 28). Graded: Premium 0W - 1L | Power 0W - 0L.

Philadelphia Eagles @ Chicago Bears
Latest verified Premium/Power recap.
Each EdgeSlate Daily Report brings the verified prior-day recap, product-by-product grading, history coverage, and Learning & Calibration notes into one readable research brief.
Navigate the board through featured product tiers, dedicated sport command centers, canonical game analysis, and a public graded record.
Top qualified selections by supported sport
Strongest qualified board-wide projections
AI-selected Morning projections
Player-level projections & market context
Start with Free Dashboard Access. Public History is open. Paid plans come after — no pressure.
Choose how you want to start: Free Dashboard Access, the $9.99 7-Day All-Access Pass, or a monthly Slate, Edge, or Quant Desk plan — each with clearly defined access.
Daily research dashboard and public graded record. No credit card; not the paid pass. Details are shown at signup.
Quant Desk for 7 days. The monthly plan chosen at checkout continues after day 7 unless canceled during those 7 days.
Monthly or annual plans with each tier’s real access. Cancel from the account; no long-term contract.
Before you choose a plan
A first-month code for Edge and Quant Desk, a paid 7-day entry, and a one-time lifetime option.
QUANT50 — 50% off the first billing period for Edge or Quant Desk.
Renews at $49/mo · Cancel anytime
Renews at $149/mo · Cancel anytime
Seven days of access to the current EdgeSlate research experience. No long-term commitment.
Start 7-day accessBest for one-sport focus: Power, Premium, AI Five, extras, and Value Dog for the sport you choose.
Best for daily multi-sport research: all eligible boards, Premium + Power, AI Five, extras, selected player-prop coverage, Telegram, and position-sizing.

 Coming Soon
Everything in Edge, plus expanded player-prop coverage, projected lineups, API access, and priority support.





21+ Please use responsibly. EdgeSlate is strictly a quantitative research tool. EdgeSlate analytics are for educational research use. Models and projections do not assure future outcomes and carry inherent variance.
Detected market: United States. Local prices are approximate until multi-currency checkout prices are configured; USD remains shown as the reference value.
High Alignment is a stricter evidence overlay — not a separate product. It appears only when independent EdgeSlate research streams converge on the same published projection, with limited conflicting evidence.
That is the differentiator: there is no forced daily quota and it is not applied to every selection. It marks a higher convergence standard when the evidence qualifies.
No long-term contracts. The 7-Day Pass can be canceled during the 7 days before the selected monthly plan continues.
Protected checkout and subscription management.
Dashboard access opens after plan confirmation.
Turn model win probability and market price into a disciplined, fractional-Kelly position size — with a built-in 5% safety cap so you never over-expose your reference unit base.
✅ Positive edge identified. Sized via Fractional Kelly with 5% risk cap.
Quantitative transparency, auditable math receipts, and published records vs. industry tools.
| FEATURE / DIMENSION |  EdgeSlate EdgeSlate |  Action Network Action Network |  BetQL BetQL |  Outlier Outlier |  Unabated Unabated |
|---|---|---|---|---|---|
| High Alignment — Independent Evidence Overlay | |||||
| Pre-Game Immutable Record Receipts | |||||
| Vig-Free Fair-Value / Model-vs-Market Probability | Partial | Partial | |||
| Public Graded Archive + Calibration Visibility | Partial | Not publicly identified | Not publicly identified | Partial | |
| Projection Rationale / Counter-Thesis Context | Articles | Stats only | Trends only | Simulators | |
| Fractional Kelly Position-Sizing Model | |||||
| Multi-Sport Research Coverage (10 Covered Sports) | Partial |
Comparison based on publicly documented product features reviewed as of September 2026. Competitor offerings may change; verify current details with each provider. All trademarks belong to their respective owners.
Share EdgeSlate with other sports researchers, quants, and analysts. 4 active referrals at your tier completely cover your own membership (25% × 4 = 100%).
What EdgeSlate is, what each access level includes, and how every result is graded.
Help centerNo. EdgeSlate is research and analytics software. It does not accept wagers and does not promise profit.
The research dashboard on distinct days with an accepted Morning board, plus the public graded record. It counts accepted Morning board days, not calendar hours. It is not an all-access trial or the paid 7-Day All-Access Pass, and no credit card is needed. Your free-access details are shown when you create your account and in your welcome email.
Seven days of Quant Desk access. The monthly plan chosen at checkout continues after day 7 unless canceled during those 7 days.
No. Every projection carries uncertainty. Public History shows wins, losses, pushes, and unresolved states.
That lane stays empty. Seats are not invented. A day with no Premium, Power, AI Five, Value Dog, or props is a valid day.
MLB, NBA, NFL, NHL, NCAAB, NCAAW, NCAAF, Soccer, WNBA, and Tennis have separate boards; visible coverage depends on season and connected sources.
History shows wins, losses, pushes, and unresolved states. Price, units, and CLV appear only when they exist.
At /history and /es/history. Every graded result can be inspected — it is not a highlight reel.
Cancel the 7-Day Pass during those 7 days to stop the selected monthly plan from continuing. Monthly plans have no long-term contract; access is managed from the account.
No. Premium Props and Power Props appear only when seats qualify. They are not a guaranteed daily product.
Projections can be wrong. EdgeSlate is a research product built around transparent records, context, and disciplined decision support.
EdgeSlate is a research tool. It publishes projections, records, and context; it does not promise outcomes or provide financial advice.
Responsible useThe platform publishes projections, grading, and context.
Every projection carries uncertainty.
Reports begin with real graded projections.
Every user owns their process.
Data and context help, never guarantee.
Stay within personal limits.
Next step
Free Dashboard Access needs no credit card. When you want more, choose the $9.99 7-Day All-Access Pass or a monthly plan. No guaranteed outcomes.











 Value Dog
 High Alignment